By Martin Murray | In The Paddock | 15 November 2026
A trade investigation in Washington can feel a long way from an Australian lamb paddock. But when the United States buys roughly a quarter of our lamb exports, decisions made there deserve our attention. The important question is not simply whether America is threatening restrictions. It is what those restrictions might look like, how much trade they could displace, and who would ultimately carry the cost.
There is a genuine market-access risk here. There is also a danger of jumping from a headline about an investigation to a conclusion that Australian lamb has been banned, or that a particular fall in saleyard prices is inevitable. Neither conclusion is justified by the current position.
The latest: a split decision, not a new import ban
On 13 November 2026, the US International Trade Commission (USITC) divided 3–3 on whether increased lamb imports were a substantial cause of serious injury to the domestic industry. The case now moves to the remedy phase. The commission will hold its remedy hearing on 1 December 2026 and send its report to the President by 11 January 2027. Both groups of commissioners’ findings will go forward; the President makes the final decision on relief. Source: USITC, 13 November 2026.
The vote itself did not introduce a new tariff, quota or ban. The Australian Meat Industry Council (AMIC) and Sheep Producers Australia confirmed that existing access arrangements were unchanged by the determination. That distinction matters: a risk has progressed to another stage, but the eventual restriction—if any—has not been settled. Source: joint Australian industry statement, 14 November 2026.
What is America actually investigating?
The investigation covers fresh, chilled and frozen lamb meat. Initiated on 13 July 2026 following a US Trade Representative request, it is a global safeguard investigation under the Trade Act of 1974, commonly described as a Section 201 case. Unlike anti-dumping or subsidy investigations, it does not require a finding of unfair trading. Its focus is injury from increased imports, across all supplying countries. Possible remedies include a tariff, quota, tariff-rate quota or adjustment assistance. Source: USITC investigation fact sheet.
Australia’s free-trade agreement is not an automatic shield. The commissioners voting in favour of an injury finding also made a separate affirmative finding concerning Australian imports. That was the position of those three commissioners, not a unanimous commission finding. The President will decide how any relief treats free-trade-agreement partners. Source: USITC determination.
There is another distinction worth keeping straight. MLA’s November 2026 State of the Industry report records a 12.5% US tariff on sheepmeat and goatmeat as at October 2026. This safeguard investigation is a separate process. “No new safeguard has been imposed” does not mean “Australian lamb currently faces no US tariff”. Source: MLA, 2026 report.
How exposed is Australian lamb?
Using the latest annual MLA report, Australia exported 342,759 tonnes of lamb in 2025, with 84,569 tonnes going to the United States. That makes the US share 24.7% by volume. These are calendar-year exports in tonnes shipped weight—not carcase-weight production, and not lamb plus mutton. Source: MLA; share calculated.
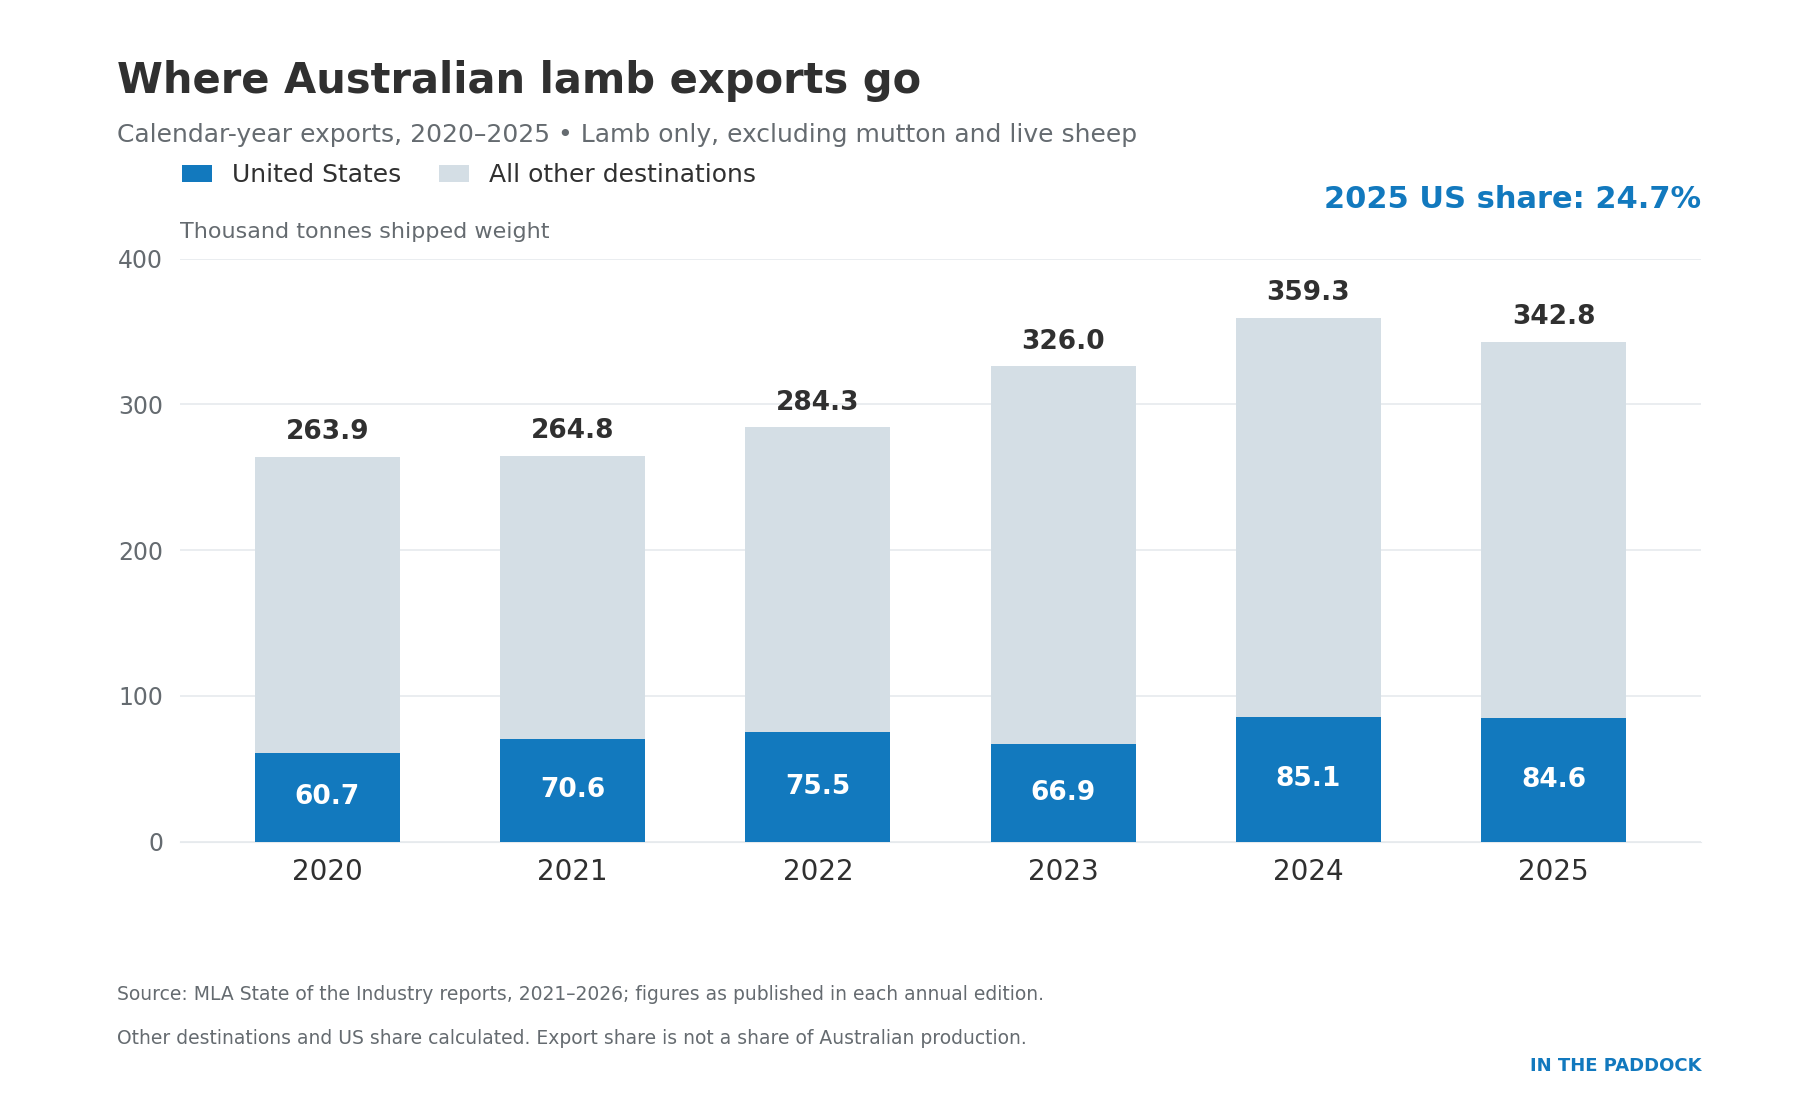
The graph makes two points. First, the US is too important to dismiss. Second, Australia already has a substantial business outside America. That is a buffer, but not a guarantee that displaced product could be sold elsewhere at the same price.
| 2025 destination | Lamb exports (tonnes swt) | Share of total |
|---|---|---|
| United States | 84,569 | 24.7% |
| Mainland China | 63,007 | 18.4% |
| United Arab Emirates | 25,163 | 7.3% |
| All other destinations | 170,020 | 49.6% |
| Total | 342,759 | 100.0% |
A tonne is not necessarily interchangeable with another tonne. Cut, specification, packaging, freight and customer demand all affect the return. Losing a buyer for a particular part of a carcase can matter more than the headline tonnage suggests. This is why the practical question for a processor is not just “Can we find another country?” It is “What return can we recover for this product, after the extra costs?”
The two sides are telling different stories
The American Sheep Industry Association’s case is that increased imports are harming US lamb producers and processors, and that relief is needed to rebuild the domestic industry. That is the industry’s argument; it should not be presented as an uncontested finding.
The Australian industry’s argument is that imported lamb complements seasonal US supply, provides continuity for retailers and foodservice, and helps sustain demand for lamb as a category. That is also an advocacy position, albeit an economically important one.
Both mechanisms are possible. Imported lamb can compete directly with domestic product. Reliable year-round supply can also help a supermarket or restaurant keep lamb on offer. The difficult question is how much of each is happening—and whether restricting imports would expand US production enough to compensate for the resulting changes in price and availability.
For Australian growers, it is worth understanding the American producer’s concern without accepting that Australia must be the sole cause of it. A trade case needs to distinguish between the effects of imports and the other pressures on a livestock industry.
America’s sheep flock has been shrinking for decades
USDA figures show US sheep and lamb inventory falling from 12.699 million head in 1980 to 4.99 million in 2026—a decline of about 60.7%. The January 2026 figure was also below the 5.025 million recorded a year earlier. Sources: USDA historical estimates and January 2026 Sheep and Goats report.
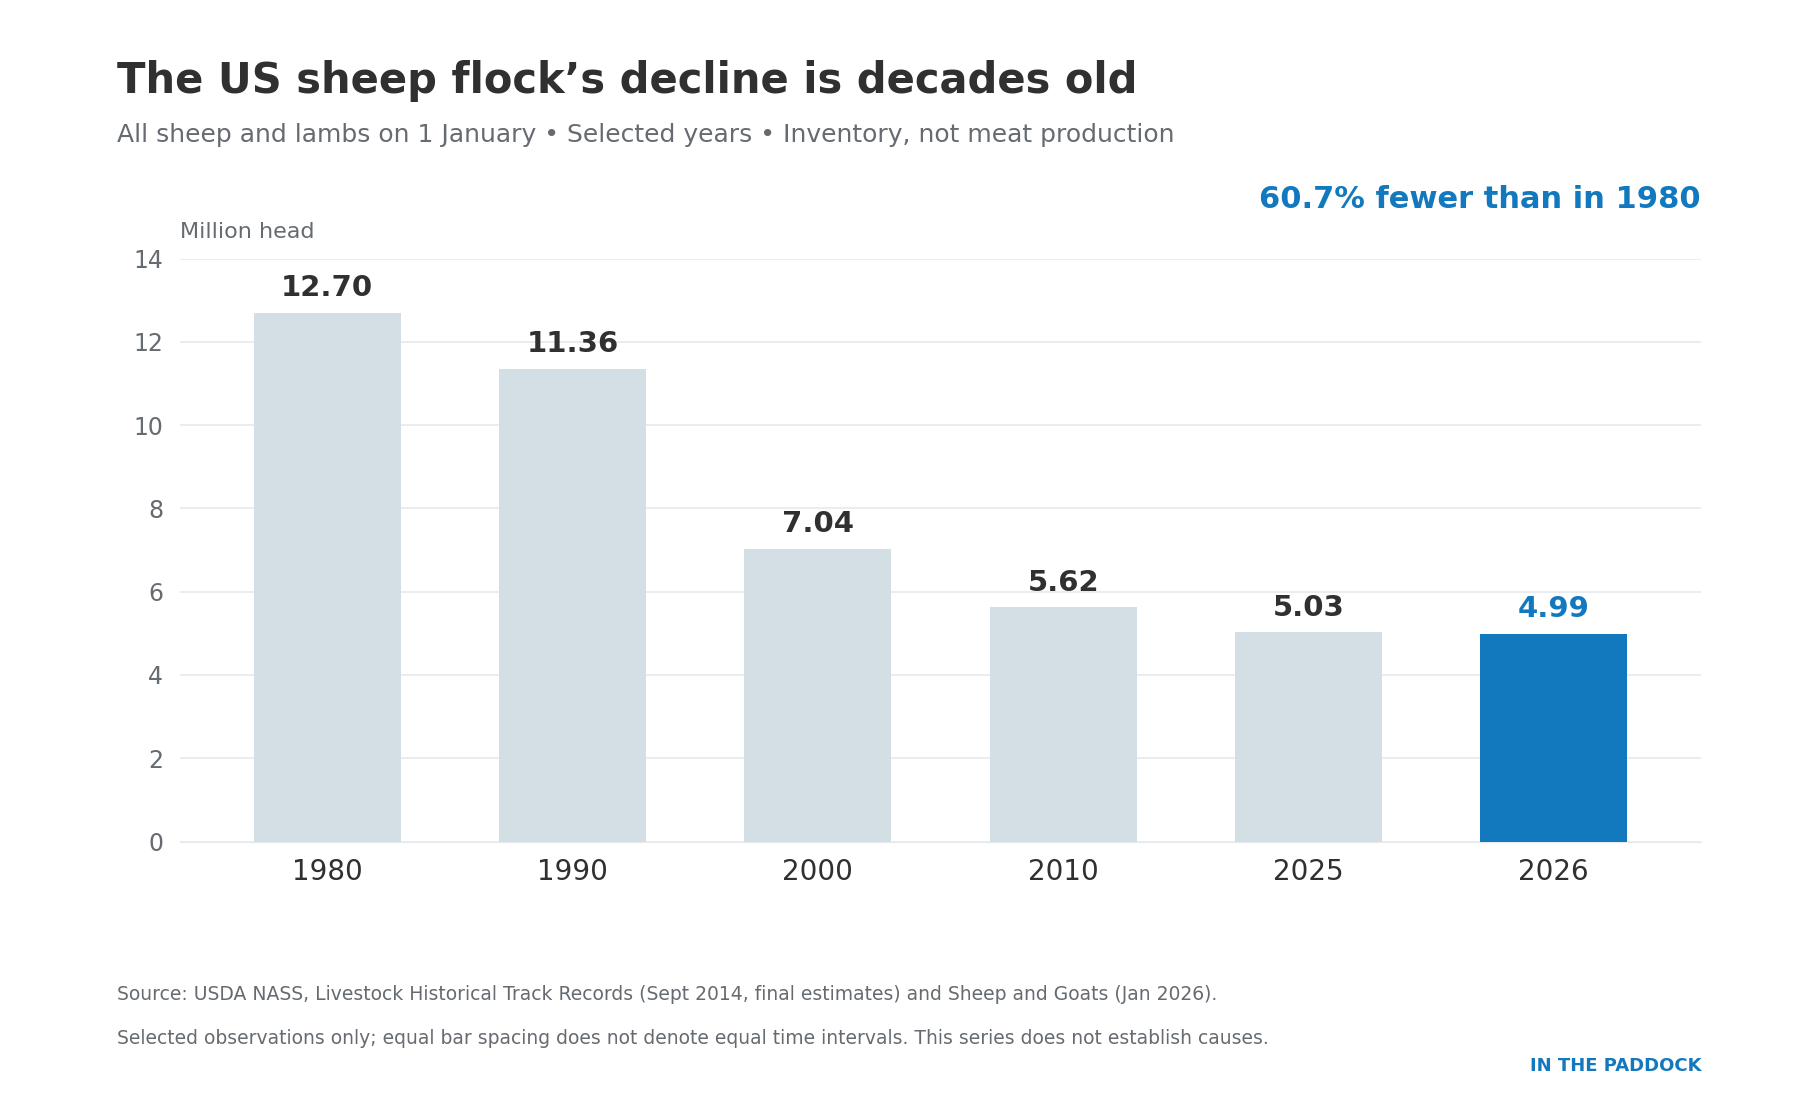
This does not prove imports are harmless. Nor does it prove they caused the decline. It shows why the question cannot be answered with a single recent export number. A long-run reduction in the flock and a legal finding about injury over a particular investigation period are different things.
My reading is that a durable solution for American sheep producers would have to address their ability to earn a competitive return and rebuild supply, not merely make foreign product more expensive. Protection may change the market price. It does not, by itself, create more breeding ewes, processing capacity or consumers willing to pay for lamb.
We have been here before: the 1999 safeguard
In July 1999, the United States introduced a tariff-rate quota on lamb. Its first-year quota was approximately 31,851 tonnes product weight. Shipments within the quota faced one tariff; those above it faced a higher rate. The enacted schedule was:
| 1999 safeguard schedule | Within quota | Above quota |
|---|---|---|
| Year 1 | 9% | 40% |
| Year 2 | 6% | 32% |
| Year 3 | 3% | 24% |
Australia challenged the measure at the World Trade Organization. The dispute findings were adopted on 16 May 2001, and the US ended the safeguard on 15 November 2001, before its planned three-year expiry. The case involved defects in the injury analysis and the legal requirements for safeguards; it was not a permanent ruling that Australian lamb could never be subject to a valid restriction. Source: WTO dispute DS178.
There is a useful lesson here: legal rights matter, but a successful challenge does not necessarily protect commercial returns while a measure is operating. And the facts, legal setting and eventual remedy in 2026 will need to be assessed on their own merits.
The historical import numbers are more interesting than the headline
USITC data show Australian lamb shipments to the US increasing from 45.186 million pounds in August 1998–July 1999 to 59.329 million pounds in August 2000–July 2001: up 31.3%. Total imports dipped in the first safeguard year, then increased. Source: USITC Publication 3512, Table IV-2.
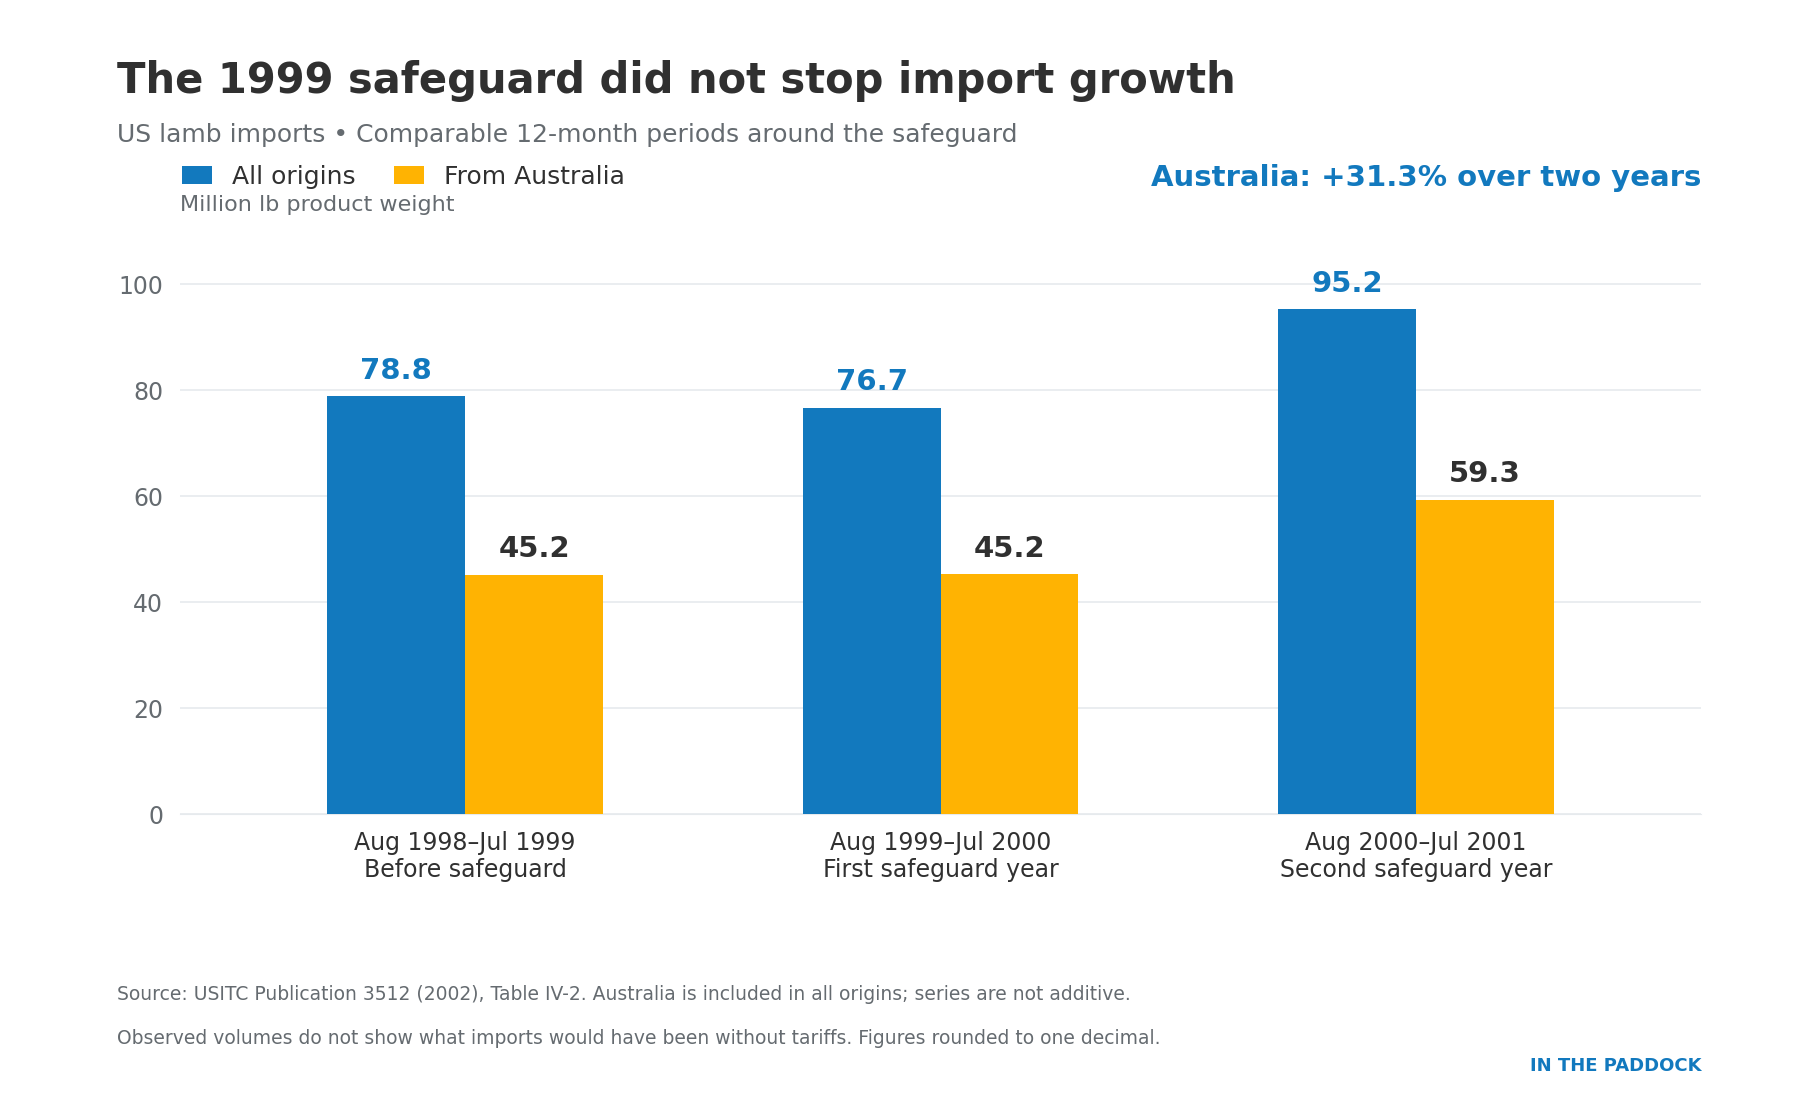
That is not evidence that tariffs were costless. Imports might have grown faster without them; exporters, importers or consumers may have absorbed costs that tonnage does not reveal. The graph cannot answer those questions.
It does, however, challenge the assumption that an additional trade barrier must automatically produce an export collapse. Price, demand, exchange rates, supply and the design of the measure interact. A quota that constrains trade is different from one that remains unfilled. A high tariff above a quota is different from the same tariff on every shipment.
How could this reach an Australian farm gate?
The transmission is not “a 20% tariff equals a 20% fall in lamb prices”. A tariff creates a cost at importation. How that cost is shared through a commercial chain depends on contracts, bargaining power, alternative suppliers and buyers’ willingness to pay.
- US customers could accept higher prices. That might preserve more of the Australian export return, but risks reducing demand if shoppers or restaurants switch to other proteins.
- Importers or exporters could absorb part of the cost. That can protect sales volumes while squeezing margins. How long it is sustainable depends on the businesses involved.
- Product could be redirected. Other destinations may take more lamb, but potentially at a lower net return or with different specifications and logistics.
- Lower processing returns could affect procurement. A processor facing a weaker return on the carcase may adjust bids, grids or throughput. The effect would also depend on Australian supply, competing buyers and currency movements.
These are possible mechanisms, not a prediction of which will dominate. The split injury vote does not provide enough information to calculate a defensible Australian farm-gate price impact.
For a sense of farm-level sensitivity, consider a purely illustrative 25 kg carcase. A change of A$0.50/kg carcase weight changes gross sale value by A$12.50 a head, or A$12,500 across 1,000 lambs, before other costs. That arithmetic is useful for a budget stress test. It is not a forecast of what this investigation will do to prices.
Three outcomes worth preparing for
| Possible outcome | What would matter commercially? |
|---|---|
| No additional safeguard relief | The investigation-related risk eases, but existing tariffs and ordinary market pressures remain. |
| Additional tariff | The rate, product coverage, commencement, duration and treatment of Australia; then how the cost is shared. |
| Quota or tariff-rate quota | The volume, country allocation, quota administration and above-quota rate—not simply the announcement of a “quota”. |
The details will matter more than the political label. A restriction that excludes Australia is a different problem from one that includes it. A generous quota and a tightly binding quota can have very different effects even if both attract the same headline.
What can producers do now?
We cannot set US trade policy from the sheep yards. We can make sure our own decisions remain grounded in the market actually in front of us.
- Ask buyers about exposure. How important is the US to their business and to the particular lamb specification you supply? What alternative outlets do they have? National export shares do not describe every processor.
- Know your cost of holding lambs. Compare a current offer with feed, growth rate, animal-health costs, seasonal risk and the next likely marketing opportunity. Waiting for a better headline is not a feed budget.
- Keep the specification in view. Weight, finish and consistency remain commercially important. An unexpected delay can change both the sale date and the grade of product offered.
- Stress-test, rather than pretend to forecast. Put several realistic price and feed-cost combinations through the budget. Identify where the preferred marketing decision changes.
- Follow decisions, not just commentary. Watch the remedy hearing, the commission’s report and any subsequent presidential action. Check the actual scope, rates and commencement dates before treating a proposal as an operating restriction.
None of that calls for panic selling or holding stock regardless of conditions. It calls for retaining options where practical and knowing what each option costs.
The bottom line
Australian lamb has a substantial business to protect in the United States. The current investigation is serious, and the move to the remedy phase deserves close attention. But the outcome remains open, and neither a ban nor a specific farm-gate price fall should be treated as settled.
The lesson from 1999 is not that trade barriers do not matter. It is that their effects are more complicated than the headline. Legal challenges, market demand and the commercial response all matter—and the cost can show up in margins as well as tonnes.
For growers, the most useful response is to understand the exposure, keep talking to buyers, and make production and marketing decisions against a range of outcomes. Our competitiveness in the paddock matters. So does our ability to reach the customer.
This article accompanies the In The Paddock episode “Aussie Lamb Under Threat?”. Find more discussions on farming, agricultural markets and technology at In The Paddock on YouTube.
Sources, data and chart notes
Current to 15 November 2026. Investigation status comes from the USITC documents linked above. Industry submissions and public statements are identified as positions, not independent proof. The scenario discussion and farm-budget illustration are analysis, not measured impacts or forecasts.
- Figure 1: MLA State of the Industry reports for 2021, 2022, 2023, 2024, 2025 and 2026. Each provides the preceding calendar year. Figures are taken as published in each edition, rather than from a single revision-consistent historical download. Monthly reports can differ. The 2025 calendar-year figures in the 2026 annual report are used consistently throughout this article.
- Figure 2: USDA NASS Livestock Historical Track Records, September 2014 (final estimates) and Sheep and Goats, January 2026. All sheep and lambs on 1 January. Years are selected observations; equal bar spacing does not represent equal elapsed time.
- Figure 3 and historical tariff schedule: USITC Publication 3512, May 2002, including Table IV-2. Imports are product weight, not carcase weight. The historical trade periods are August–July, not calendar years. The WTO chronology is from DS178.
Graphs are original visualisations of the cited data. Rounded labels aid readability; calculations use the reported underlying figures. The featured image is an AI-assisted editorial composite, not a documentary photograph of a trade event.

